
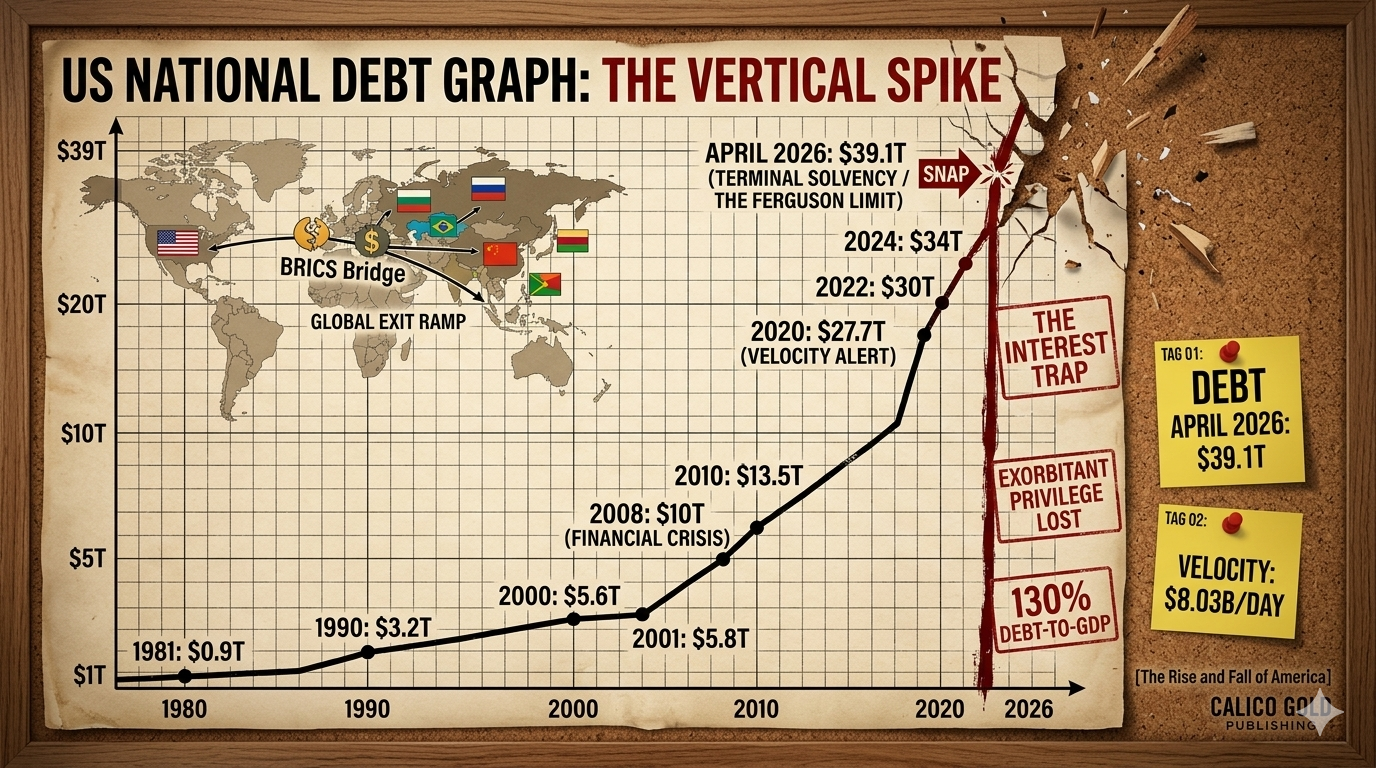
When you look at a US National Debt Graph, you aren’t just seeing a fiscal report; you are witnessing the “Hockey Stick” curve of a superpower in transition. In the forensic investigation of our economy, the graph serves as the primary piece of evidence showing the move from linear growth to exponential debt accumulation. As of April 2026, the US National Debt Graph has officially breached the $39 trillion threshold, creating a vertical line that signals we have entered the “Interest Trap.”

“The Rise and Fall of America –
History’s Warning: America in the Crosshairs of Collapse”
Get Your Copy Now — Download Immediately
The paperback edition is available through Amazon, Barnes & Noble, Google Play Books, Apple Books, and wherever books are sold.
The Visual Proof of Terminal Velocity
The most striking feature of the current US National Debt Graph is the acceleration since 2020. While the US National Debt by Year showed a steady climb for decades, the post-2020 era on the graph reflects a “Shatter Event” in real-time. We are currently adding debt at a velocity of $8.03 billion per day, a rate that has caused the graph to turn nearly 90 degrees upward. As I discuss in The Rise and Fall of America, this isn’t a curve that can be sustained by traditional economic growth.
Interest Costs: The Graph Within the Graph
If you layer a secondary line over the US National Debt Graph to show interest payments, the forensic picture becomes even more dire. By March 2026, interest outlays reached $1 trillion annually, a figure that now rivals the entire defense budget. This “Internal Debt” is the primary reason why the American Debt-to-GDP ratio matters. When the graph of what we owe rises faster than the graph of what we produce, the gap is filled by the devaluation of the currency.
“The Rise and Fall of America –
History’s Warning: America in the Crosshairs of Collapse”
Get Your Copy Now — Download Immediately
The paperback edition is available through Amazon, Barnes & Noble, Google Play Books, Apple Books, and wherever books are sold.
Predicting the “Snap”
Looking forward on the US National Debt Graph, the trajectory suggests we will reach $40 trillion before the end of 2026. This isn’t just a round number; it’s a psychological tipping point for global markets. This data is the central reason for the BRICS Pivot, as foreign nations look at the American graph and see a borrower who has lost control of the ledger. For those asking is the United States in decline?, the graph is the ultimate forensic verdict.
“The Rise and Fall of America –
History’s Warning: America in the Crosshairs of Collapse”
Get Your Copy Now — Download Immediately
The paperback edition is available through Amazon, Barnes & Noble, Google Play Books, Apple Books, and wherever books are sold.
Frequently Asked Questions
- How has the national debt grown over time? Historically, the national debt remained low relative to the economy until the late 20th century. However, the US National Debt Graph shows a dramatic shift after 2000, doubling nearly every decade. Between 2020 and April 2026, the growth turned exponential, adding over $10 trillion in just five years—more than the total debt accumulated in the nation’s first 200 years.
- What is the current US national debt? As of April 10, 2026, the total gross national debt has reached $39 trillion. This figure includes both debt held by the public and intragovernmental holdings. At the current growth rate of $8.03 billion per day, the U.S. is on track to add another trillion dollars every five months, fueled by persistent deficits and surging interest costs.
- How much does the US pay in interest on the national debt? In fiscal year 2026, interest payments have hit the $1 trillion milestone. This means approximately 19 cents of every dollar collected in federal taxes is now redirected just to service the interest on past borrowing. Interest is currently the fastest-growing category in the federal budget, now exceeding the total annual spend on national defense.
- Why does the U.S. have so much debt? The debt is driven by a structural mismatch between spending and revenue. The “Big Three”—Social Security, Medicare, and now interest on the debt—consume the vast majority of federal outlays. Combined with an aging population and a tax code that does not generate sufficient revenue to cover these promised obligations, the US National Debt Graph reflects a permanent, systemic deficit.
- What is the debt ceiling? The debt ceiling is the legal limit set by Congress on the total amount of money the U.S. Treasury can borrow to pay for existing obligations. It does not authorize new spending but allows the government to fund what has already been approved. Following the 2025 suspension, the limit continues to be a central point of forensic instability as the debt rapidly approaches $40 trillion.
- What happens if the U.S. defaults on its debt? A default would trigger a global financial “Shatter Event.” Treasury bonds would lose their “safe-haven” status, causing interest rates on everything from mortgages to car loans to skyrocket. Stock markets would likely plummet, retirement accounts would be decimated, and the U.S. dollar would face immediate devaluation as the global reserve currency, permanently raising the cost of living for all Americans.
About the Author: James C. Tanner is a former special investigator and the owner of Calico GOLD Publishing. For a deep dive into the 2026 fiscal “snap,” read The Rise and Fall of America—History’s Warning: America in the Crosshairs of Collapse.
1 thought on “US National Debt Graph: Mapping the 2026 Shatter Event”
Comments are closed.